Reporting Dashboard
You will get access to an online dashboard published by Liberty Rider with metrics and data about usage. This data can be used for business purposes or to help your developers during tests. Most data is updated live, some data is updated daily. Each will be provided for Production and Staging:
- Monthly volume of SDK usage (sessions)
- Monthly volume of emergencies
- List of recent emergencies (identifier, timestamp, user ID, user name, phone number, platform, application version)…
- Locations of emergencies

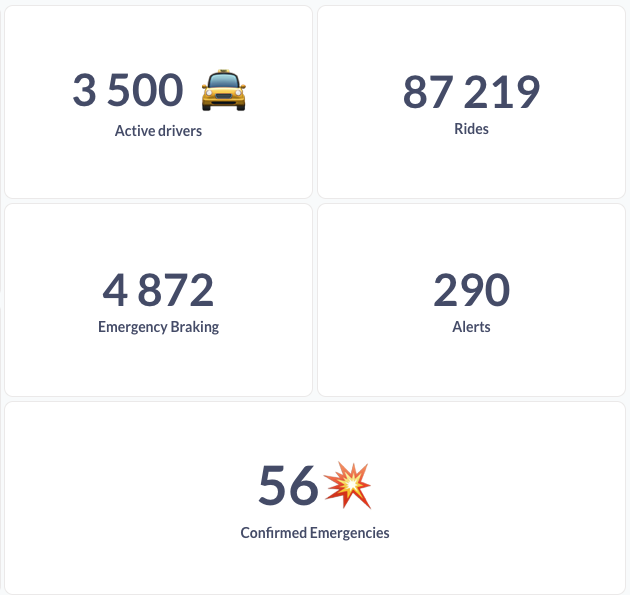
Key Performance Indicators
By default, 5 KPIs are provided:
- Active Drivers
- Rides
- Emergency Braking
- Alerts
- Emergencies
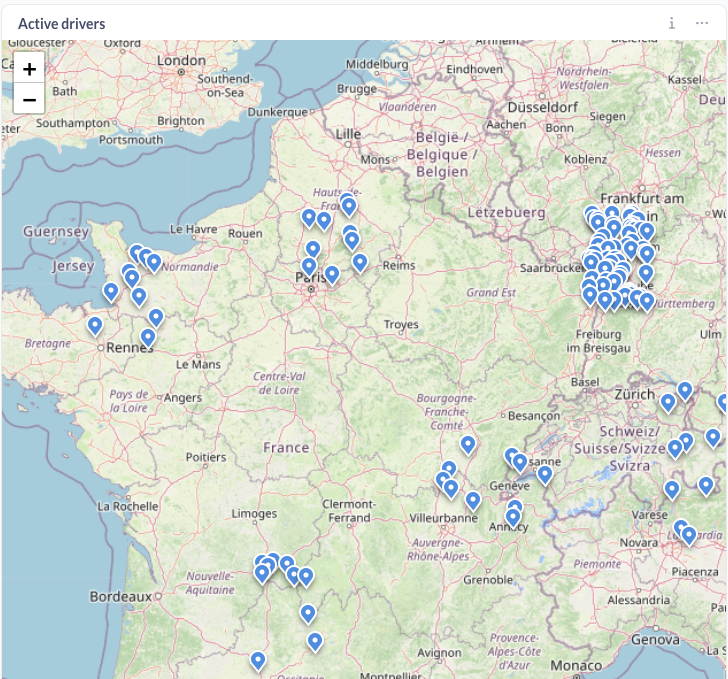
Active Driver Map
This map allows you to geographically visualize your active users.
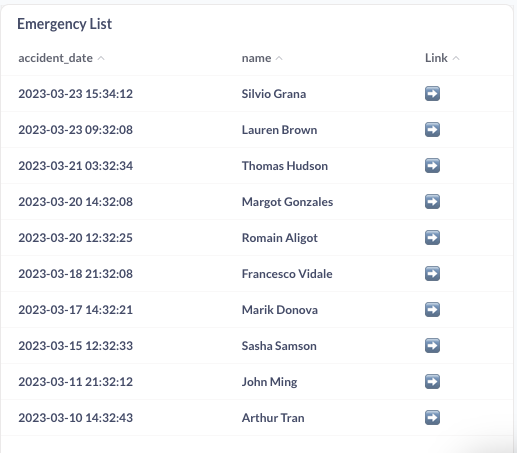
Emergency List
In this list, recent emergencies are referenced. A button provides more information about the crash and the user.
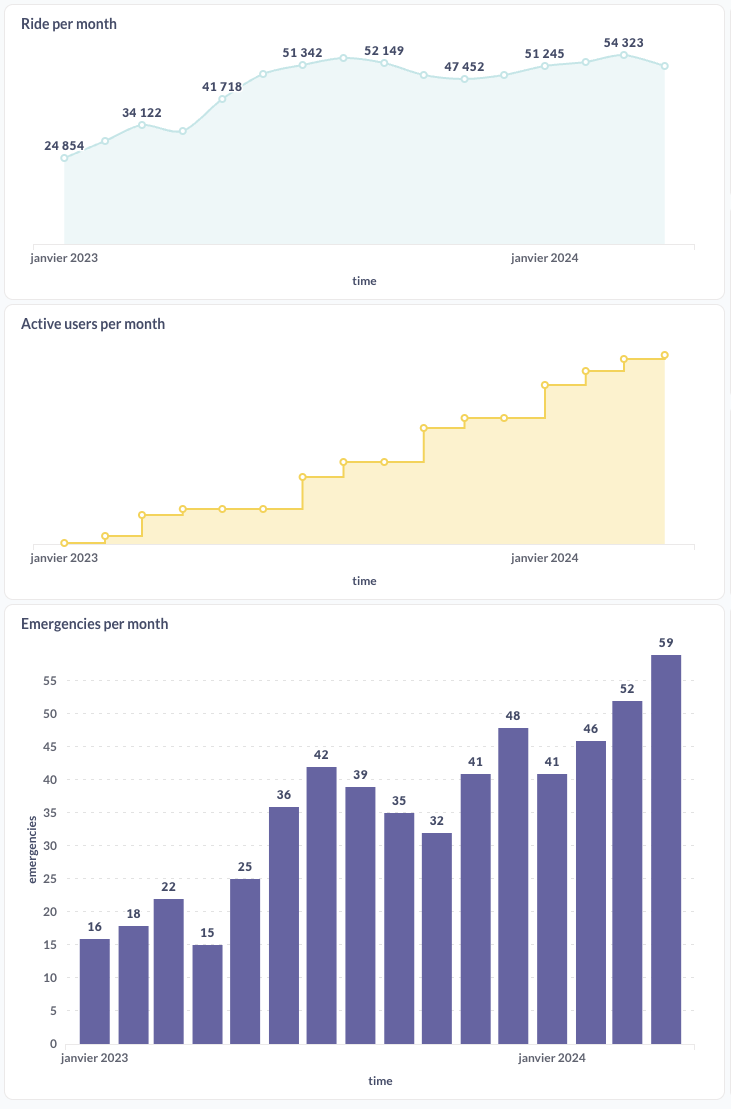
Monthly charts
Three monthly charts are provided:
- Rides per month
- Registered Users per month
- Emergencies per month